List of Tables
Table 1. Global Weapon Scope Sales (US$ Million) Growth Rate by Type (2020 & 2024 & 2031)
Table 2. Global Weapon Scope Sales (US$ Million) Comparison by Application (2020 & 2024 & 2031)
Table 3. Global Market Weapon Scope Market Size (US$ Million) by Region:2020 VS 2024 VS 2031
Table 4. Global Weapon Scope Sales (K Units) by Region (2020-2025)
Table 5. Global Weapon Scope Sales Market Share by Region (2020-2025)
Table 6. Global Weapon Scope Revenue (US$ Million) Market Share by Region (2020-2025)
Table 7. Global Weapon Scope Revenue Share by Region (2020-2025)
Table 8. Global Weapon Scope Sales (K Units) Forecast by Region (2026-2031)
Table 9. Global Weapon Scope Sales Market Share Forecast by Region (2026-2031)
Table 10. Global Weapon Scope Revenue (US$ Million) Forecast by Region (2026-2031)
Table 11. Global Weapon Scope Revenue Share Forecast by Region (2026-2031)
Table 12. Global Weapon Scope Sales by Type (K Units) & (2020-2025)
Table 13. Global Weapon Scope Sales Share by Type (2020-2025)
Table 14. Global Weapon Scope Revenue by Type (US$ Million) & (2020-2025)
Table 15. Global Weapon Scope Price by Type (USD/Unit) & (2020-2025)
Table 16. Global Weapon Scope Sales by Type (K Units) & (2026-2031)
Table 17. Global Weapon Scope Revenue by Type (US$ Million) & (2026-2031)
Table 18. Global Weapon Scope Price by Type (USD/Unit) & (2026-2031)
Table 19. Representative Players of Each Type
Table 20. Global Weapon Scope Sales by Application (K Units) & (2020-2025)
Table 21. Global Weapon Scope Sales Share by Application (2020-2025)
Table 22. Global Weapon Scope Revenue by Application (US$ Million) & (2020-2025)
Table 23. Global Weapon Scope Price by Application (USD/Unit) & (2020-2025)
Table 24. Global Weapon Scope Sales by Application (K Units) & (2026-2031)
Table 25. Global Weapon Scope Revenue Market Share by Application (US$ Million) & (2026-2031)
Table 26. Global Weapon Scope Price by Application (USD/Unit) & (2026-2031)
Table 27. New Sources of Growth in Weapon Scope Application
Table 28. Global Weapon Scope Sales by Company (K Units) & (2020-2025)
Table 29. Global Weapon Scope Sales Share by Company (2020-2025)
Table 30. Global Weapon Scope Revenue by Company (US$ Million) & (2020-2025)
Table 31. Global Weapon Scope Revenue Share by Company (2020-2025)
Table 32. Global Weapon Scope by Company Type (Tier 1, Tier 2, and Tier 3) & (based on the Revenue in Weapon Scope as of 2024)
Table 33. Global Market Weapon Scope Average Price by Company (USD/Unit) & (2020-2025)
Table 34. Global Key Manufacturers of Weapon Scope, Manufacturing Sites & Headquarters
Table 35. Global Key Manufacturers of Weapon Scope, Product Type & Application
Table 36. Global Key Manufacturers of Weapon Scope, Date of Enter into This Industry
Table 37. Manufacturers Mergers & Acquisitions, Expansion Plans
Table 38. North America Weapon Scope Sales by Company (2020-2025) & (K Units)
Table 39. North America Weapon Scope Sales Market Share by Company (2020-2025)
Table 40. North America Weapon Scope Revenue by Company (2020-2025) & (US$ Million)
Table 41. North America Weapon Scope Revenue Market Share by Company (2020-2025)
Table 42. North America Weapon Scope Sales by Type (2020-2025) & (K Units)
Table 43. North America Weapon Scope Sales Market Share by Type (2020-2025)
Table 44. North America Weapon Scope Sales by Application (2020-2025) & (K Units)
Table 45. North America Weapon Scope Sales Market Share by Application (2020-2025)
Table 46. Europe Weapon Scope Sales by Company (2020-2025) & (K Units)
Table 47. Europe Weapon Scope Sales Market Share by Company (2020-2025)
Table 48. Europe Weapon Scope Revenue by Company (2020-2025) & (US$ Million)
Table 49. Europe Weapon Scope Revenue Market Share by Company (2020-2025)
Table 50. Europe Weapon Scope Sales by Type (2020-2025) & (K Units)
Table 51. Europe Weapon Scope Sales Market Share by Type (2020-2025)
Table 52. Europe Weapon Scope Sales by Application (2020-2025) & (K Units)
Table 53. Europe Weapon Scope Sales Market Share by Application (2020-2025)
Table 54. China Weapon Scope Sales by Company (2020-2025) & (K Units)
Table 55. China Weapon Scope Sales Market Share by Company (2020-2025)
Table 56. China Weapon Scope Revenue by Company (2020-2025) & (US$ Million)
Table 57. China Weapon Scope Revenue Market Share by Company (2020-2025)
Table 58. China Weapon Scope Sales by Type (2020-2025) & (K Units)
Table 59. China Weapon Scope Sales Market Share by Type (2020-2025)
Table 60. China Weapon Scope Sales by Application (2020-2025) & (K Units)
Table 61. China Weapon Scope Sales Market Share by Application (2020-2025)
Table 62. Japan Weapon Scope Sales by Company (2020-2025) & (K Units)
Table 63. Japan Weapon Scope Sales Market Share by Company (2020-2025)
Table 64. Japan Weapon Scope Revenue by Company (2020-2025) & (US$ Million)
Table 65. Japan Weapon Scope Revenue Market Share by Company (2020-2025)
Table 66. Japan Weapon Scope Sales by Type (2020-2025) & (K Units)
Table 67. Japan Weapon Scope Sales Market Share by Type (2020-2025)
Table 68. Japan Weapon Scope Sales by Application (2020-2025) & (K Units)
Table 69. Japan Weapon Scope Sales Market Share by Application (2020-2025)
Table 70. Bushnell Company Information
Table 71. Bushnell Description and Business Overview
Table 72. Bushnell Weapon Scope Sales (K Units), Revenue (US$ Million), Price (USD/Unit) and Gross Margin (2020-2025)
Table 73. Bushnell Weapon Scope Product
Table 74. Bushnell Recent Development
Table 75. Leupold Company Information
Table 76. Leupold Description and Business Overview
Table 77. Leupold Weapon Scope Sales (K Units), Revenue (US$ Million), Price (USD/Unit) and Gross Margin (2020-2025)
Table 78. Leupold Weapon Scope Product
Table 79. Leupold Recent Development
Table 80. Burris Company Information
Table 81. Burris Description and Business Overview
Table 82. Burris Weapon Scope Sales (K Units), Revenue (US$ Million), Price (USD/Unit) and Gross Margin (2020-2025)
Table 83. Burris Weapon Scope Product
Table 84. Burris Recent Development
Table 85. Nikon Company Information
Table 86. Nikon Description and Business Overview
Table 87. Nikon Weapon Scope Sales (K Units), Revenue (US$ Million), Price (USD/Unit) and Gross Margin (2020-2025)
Table 88. Nikon Weapon Scope Product
Table 89. Nikon Recent Development
Table 90. Schmidt-Bender Company Information
Table 91. Schmidt-Bender Description and Business Overview
Table 92. Schmidt-Bender Weapon Scope Sales (K Units), Revenue (US$ Million), Price (USD/Unit) and Gross Margin (2020-2025)
Table 93. Schmidt-Bender Weapon Scope Product
Table 94. Schmidt-Bender Recent Development
Table 95. WALTHER Company Information
Table 96. WALTHER Description and Business Overview
Table 97. WALTHER Weapon Scope Sales (K Units), Revenue (US$ Million), Price (USD/Unit) and Gross Margin (2020-2025)
Table 98. WALTHER Weapon Scope Product
Table 99. WALTHER Recent Development
Table 100. Hawke Optics Company Information
Table 101. Hawke Optics Description and Business Overview
Table 102. Hawke Optics Weapon Scope Sales (K Units), Revenue (US$ Million), Price (USD/Unit) and Gross Margin (2020-2025)
Table 103. Hawke Optics Weapon Scope Product
Table 104. Hawke Optics Recent Development
Table 105. Nightforce Company Information
Table 106. Nightforce Description and Business Overview
Table 107. Nightforce Weapon Scope Sales (K Units), Revenue (US$ Million), Price (USD/Unit) and Gross Margin (2020-2025)
Table 108. Nightforce Weapon Scope Product
Table 109. Nightforce Recent Development
Table 110. BSA Company Information
Table 111. BSA Description and Business Overview
Table 112. BSA Weapon Scope Sales (K Units), Revenue (US$ Million), Price (USD/Unit) and Gross Margin (2020-2025)
Table 113. BSA Weapon Scope Product
Table 114. BSA Recent Development
Table 115. Hensoldt Company Information
Table 116. Hensoldt Description and Business Overview
Table 117. Hensoldt Weapon Scope Sales (K Units), Revenue (US$ Million), Price (USD/Unit) and Gross Margin (2020-2025)
Table 118. Hensoldt Weapon Scope Product
Table 119. Hensoldt Recent Development
Table 120. Vortex Optics Company Information
Table 121. Vortex Optics Description and Business Overview
Table 122. Vortex Optics Weapon Scope Sales (K Units), Revenue (US$ Million), Price (USD/Unit) and Gross Margin (2020-2025)
Table 123. Vortex Optics Weapon Scope Product
Table 124. Vortex Optics Recent Development
Table 125. Barska Company Information
Table 126. Barska Description and Business Overview
Table 127. Barska Weapon Scope Sales (K Units), Revenue (US$ Million), Price (USD/Unit) and Gross Margin (2020-2025)
Table 128. Barska Weapon Scope Product
Table 129. Barska Recent Development
Table 130. Aimpoint Company Information
Table 131. Aimpoint Description and Business Overview
Table 132. Aimpoint Weapon Scope Sales (K Units), Revenue (US$ Million), Price (USD/Unit) and Gross Margin (2020-2025)
Table 133. Aimpoint Weapon Scope Product
Table 134. Aimpoint Recent Development
Table 135. LEAPERS Company Information
Table 136. LEAPERS Description and Business Overview
Table 137. LEAPERS Weapon Scope Sales (K Units), Revenue (US$ Million), Price (USD/Unit) and Gross Margin (2020-2025)
Table 138. LEAPERS Weapon Scope Product
Table 139. LEAPERS Recent Development
Table 140. Tasco Company Information
Table 141. Tasco Description and Business Overview
Table 142. Tasco Weapon Scope Sales (K Units), Revenue (US$ Million), Price (USD/Unit) and Gross Margin (2020-2025)
Table 143. Tasco Weapon Scope Product
Table 144. Tasco Recent Development
Table 145. Swarovski Company Information
Table 146. Swarovski Description and Business Overview
Table 147. Swarovski Weapon Scope Sales (K Units), Revenue (US$ Million), Price (USD/Unit) and Gross Margin (2020-2025)
Table 148. Swarovski Weapon Scope Product
Table 149. Swarovski Recent Development
Table 150. Weaveroptics Company Information
Table 151. Weaveroptics Description and Business Overview
Table 152. Weaveroptics Weapon Scope Sales (K Units), Revenue (US$ Million), Price (USD/Unit) and Gross Margin (2020-2025)
Table 153. Weaveroptics Weapon Scope Product
Table 154. Weaveroptics Recent Development
Table 155. Meopta Company Information
Table 156. Meopta Description and Business Overview
Table 157. Meopta Weapon Scope Sales (K Units), Revenue (US$ Million), Price (USD/Unit) and Gross Margin (2020-2025)
Table 158. Meopta Weapon Scope Product
Table 159. Meopta Recent Development
Table 160. Gamo Company Information
Table 161. Gamo Description and Business Overview
Table 162. Gamo Weapon Scope Sales (K Units), Revenue (US$ Million), Price (USD/Unit) and Gross Margin (2020-2025)
Table 163. Gamo Weapon Scope Product
Table 164. Gamo Recent Development
Table 165. Vector Optics Company Information
Table 166. Vector Optics Description and Business Overview
Table 167. Vector Optics Weapon Scope Sales (K Units), Revenue (US$ Million), Price (USD/Unit) and Gross Margin (2020-2025)
Table 168. Vector Optics Weapon Scope Product
Table 169. Vector Optics Recent Development
Table 170. Zeiss Company Information
Table 171. Zeiss Description and Business Overview
Table 172. Zeiss Weapon Scope Sales (K Units), Revenue (US$ Million), Price (USD/Unit) and Gross Margin (2020-2025)
Table 173. Zeiss Weapon Scope Product
Table 174. Zeiss Recent Development
Table 175. Trijicon Company Information
Table 176. Trijicon Description and Business Overview
Table 177. Trijicon Weapon Scope Sales (K Units), Revenue (US$ Million), Price (USD/Unit) and Gross Margin (2020-2025)
Table 178. Trijicon Weapon Scope Product
Table 179. Trijicon Recent Development
Table 180. Crimson Trace Company Information
Table 181. Crimson Trace Description and Business Overview
Table 182. Crimson Trace Weapon Scope Sales (K Units), Revenue (US$ Million), Price (USD/Unit) and Gross Margin (2020-2025)
Table 183. Crimson Trace Weapon Scope Product
Table 184. Crimson Trace Recent Development
Table 185. Norinco Group Company Information
Table 186. Norinco Group Description and Business Overview
Table 187. Norinco Group Weapon Scope Sales (K Units), Revenue (US$ Million), Price (USD/Unit) and Gross Margin (2020-2025)
Table 188. Norinco Group Weapon Scope Product
Table 189. Norinco Group Recent Development
Table 190. Sam Electrical Equipments Company Information
Table 191. Sam Electrical Equipments Description and Business Overview
Table 192. Sam Electrical Equipments Weapon Scope Sales (K Units), Revenue (US$ Million), Price (USD/Unit) and Gross Margin (2020-2025)
Table 193. Sam Electrical Equipments Weapon Scope Product
Table 194. Sam Electrical Equipments Recent Development
Table 195. Nantong Universal Optical Instrument Company Information
Table 196. Nantong Universal Optical Instrument Description and Business Overview
Table 197. Nantong Universal Optical Instrument Weapon Scope Sales (K Units), Revenue (US$ Million), Price (USD/Unit) and Gross Margin (2020-2025)
Table 198. Nantong Universal Optical Instrument Weapon Scope Product
Table 199. Nantong Universal Optical Instrument Recent Development
Table 200. Ntans Company Information
Table 201. Ntans Description and Business Overview
Table 202. Ntans Weapon Scope Sales (K Units), Revenue (US$ Million), Price (USD/Unit) and Gross Margin (2020-2025)
Table 203. Ntans Weapon Scope Product
Table 204. Ntans Recent Development
Table 205. ATN Corp Company Information
Table 206. ATN Corp Description and Business Overview
Table 207. ATN Corp Weapon Scope Sales (K Units), Revenue (US$ Million), Price (USD/Unit) and Gross Margin (2020-2025)
Table 208. ATN Corp Weapon Scope Product
Table 209. ATN Corp Recent Development
Table 210. Armasight Company Information
Table 211. Armasight Description and Business Overview
Table 212. Armasight Weapon Scope Sales (K Units), Revenue (US$ Million), Price (USD/Unit) and Gross Margin (2020-2025)
Table 213. Armasight Weapon Scope Product
Table 214. Armasight Recent Development
Table 215. Starlight Company Information
Table 216. Starlight Description and Business Overview
Table 217. Starlight Weapon Scope Sales (K Units), Revenue (US$ Million), Price (USD/Unit) and Gross Margin (2020-2025)
Table 218. Starlight Weapon Scope Product
Table 219. Starlight Recent Development
Table 220. Production Base and Market Concentration Rate of Raw Material
Table 221. Key Suppliers of Raw Materials
Table 222. Weapon Scope Distributors List
Table 223. Weapon Scope Customers List
Table 224. Weapon Scope Market Trends
Table 225. Weapon Scope Market Drivers
Table 226. Weapon Scope Market Challenges
Table 227. Weapon Scope Market Restraints
Table 228. Research Programs/Design for This Report
Table 229. Key Data Information from Secondary Sources
Table 230. Key Data Information from Primary Sources
List of Figures
Figure 1. Weapon Scope Product Picture
Figure 2. Global Weapon Scope Sales (US$ Million) by Type (2020 & 2024 & 2031)
Figure 3. Global Weapon Scope Sales Market Share by Type in 2024 & 2031
Figure 4. Telescopic Sight Product Picture
Figure 5. Collimating Optical Sight Product Picture
Figure 6. Reflex Sight Product Picture
Figure 7. Other Product Picture
Figure 8. Global Weapon Scope Sales (US$ Million) by Application (2020 & 2024 & 2031)
Figure 9. Global Weapon Scope Sales Market Share by Application in 2024 & 2031
Figure 10. Hunting Examples
Figure 11. Military and Law Enforcement Examples
Figure 12. Other Examples
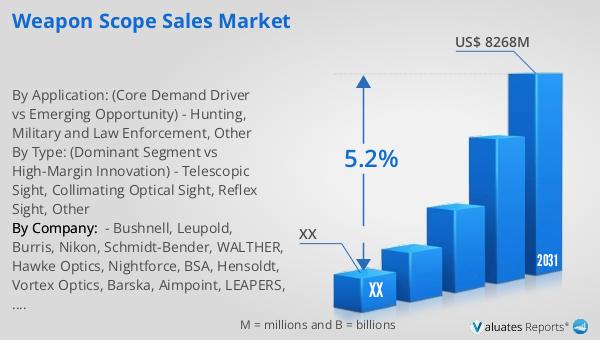
Figure 13. Global Weapon Scope Sales, (US$ Million), 2020 VS 2024 VS 2031
Figure 14. Global Weapon Scope Sales Growth Rate (2020-2031) & (US$ Million)
Figure 15. Global Weapon Scope Sales (K Units) Growth Rate (2020-2031)
Figure 16. Global Weapon Scope Price Trends Growth Rate (2020-2031) & (USD/Unit)
Figure 17. Weapon Scope Report Years Considered
Figure 18. Global Market Weapon Scope Market Size (US$ Million) by Region:2020 VS 2024 VS 2031
Figure 19. Global Weapon Scope Revenue Market Share by Region: 2020 VS 2024
Figure 20. North America Weapon Scope Revenue (US$ Million) Growth Rate (2020-2031)
Figure 21. North America Weapon Scope Sales (K Units) Growth Rate (2020-2031)
Figure 22. Europe Weapon Scope Revenue (US$ Million) Growth Rate (2020-2031)
Figure 23. Europe Weapon Scope Sales (K Units) Growth Rate (2020-2031)
Figure 24. China Weapon Scope Revenue (US$ Million) Growth Rate (2020-2031)
Figure 25. China Weapon Scope Sales (K Units) Growth Rate (2020-2031)
Figure 26. Japan Weapon Scope Revenue (US$ Million) Growth Rate (2020-2031)
Figure 27. Japan Weapon Scope Sales (K Units) Growth Rate (2020-2031)
Figure 28. Global Weapon Scope Revenue Share by Type (2020-2025)
Figure 29. Global Weapon Scope Sales Share by Type (2026-2031)
Figure 30. Global Weapon Scope Revenue Share by Type (2026-2031)
Figure 31. Global Weapon Scope Revenue Share by Application (2020-2025)
Figure 32. Global Weapon Scope Revenue Growth Rate by Application in 2020 & 2024
Figure 33. Global Weapon Scope Sales Share by Application (2026-2031)
Figure 34. Global Weapon Scope Revenue Share by Application (2026-2031)
Figure 35. Global Weapon Scope Sales Share by Company (2024)
Figure 36. Global Weapon Scope Revenue Share by Company (2024)
Figure 37. Global 5 Largest Weapon Scope Players Market Share by Revenue in Weapon Scope: 2020 & 2024
Figure 38. Weapon Scope Market Share by Company Type (Tier 1, Tier 2, and Tier 3): 2020 VS 2024
Figure 39. Manufacturing Cost Structure of Weapon Scope
Figure 40. Manufacturing Process Analysis of Weapon Scope
Figure 41. Weapon Scope Industrial Chain
Figure 42. Channels of Distribution (Direct Vs Distribution)
Figure 43. Distributors Profiles
Figure 44. Bottom-up and Top-down Approaches for This Report
Figure 45. Data Triangulation
Figure 46. Key Executives Interviewed