0
U.S. (TOLL FREE)
+1 (315) 215-3225
Automative

0
U.S. (TOLL FREE)
+1 (315) 215-3225
Urinary System Drugs - Global Market Share and Ranking, Overall Sales and Demand Forecast 2024-2030
Published Date: December 2024
|
Report Code: QYRE-Auto-16V10252
Home | Market Reports | Business & Industrial| Pharmaceuticals & Biotech
Global Urinary System Drugs Market Insights and Forecast to 2028
BUY CHAPTERS

Urinary System Drugs - Global Market Share and Ranking, Overall Sales and Demand Forecast 2024-2030

Code: QYRE-Auto-16V10252
Report
December 2024
Pages:163
QYResearch
Buy Now with 15% Discount
DESCRIPTION
TABLE OF CONTENT
TABLES & FIGURES

Urinary System Drugs - Market Size

The global pharmaceutical market is 1475 billion USD in 2022, growing at a CAGR of 5% during the next six years.

Urinary System Drugs - Market

Urinary System Drugs - Market

The global market for Urinary System Drugs was estimated to be worth US$ million in 2023 and is forecast to a readjusted size of US$ million by 2030 with a CAGR of % during the forecast period 2024-2030.
The pharmaceutical market includes chemical drugs and biological drugs. For biologics is expected to 381 billion USD in 2022. In comparison, the chemical drug market is estimated to increase from 1005 billion in 2018 to 1094 billion U.S. dollars in 2022. The pharmaceutical market factors such as increasing demand for healthcare, technological advancements, and the rising prevalence of chronic diseases, increase in funding from private & government organizations for development of pharmaceutical manufacturing segments and rise in R&D activities for drugs. However, the industry also faces challenges such as stringent regulations, high costs of research and development, and patent expirations. Companies need to continuously innovate and adapt to these challenges to stay competitive in the market and ensure their products reach patients in need. Additionally, the COVID-19 pandemic has highlighted the importance of vaccine development and supply chain management, further emphasizing the need for pharmaceutical companies to be agile and responsive to emerging public health needs.

Report Scope

This report aims to provide a comprehensive presentation of the global market for Urinary System Drugs, focusing on the total sales revenue, key companies market share and ranking, together with an analysis of Urinary System Drugs by region & country, by Type, and by Application.
The Urinary System Drugs market size, estimations, and forecasts are provided in terms of sales revenue ($ millions), considering 2023 as the base year, with history and forecast data for the period from 2019 to 2030. With both quantitative and qualitative analysis, to help readers develop business/growth strategies, assess the market competitive situation, analyze their position in the current marketplace, and make informed business decisions regarding Urinary System Drugs.
Market Segmentation

Scope of Urinary System Drugs - Market Report

Report Metric Details
Report Name Urinary System Drugs - Market
CAGR 5%
Segment by Type:
  • Injection
  • Tablets
  • Capsule
  • Suppository
  • Granules
  • Powder
  • Pills
  • Cream
  • Others
Segment by Application
  • Kidney Disease Medication
  • Medication For Prostate Disease
  • Male Dysfunction
  • Lithotripsy Drug
  • Others
By Region
  • North America (United States, Canada)
  • Europe (Germany, France, UK, Italy, Russia) Rest of Europe
  • Nordic Countries
  • Asia-Pacific (China, Japan, South Korea)
  • Southeast Asia (India, Australia)
  • Rest of Asia
  • Latin America (Mexico, Brazil)
  • Rest of Latin America
  • Middle East & Africa (Turkey, Saudi Arabia, UAE, Rest of MEA)
By Company Johnson & Johnson, Bayer, Pfizer, GSK, Boehringer Ingelheim, Roche, Novartis, AstraZeneca, Dr. Reddy’s Laboratories, Mylan, Sun Pharma, Cipla, Merck, Cubist Pharmaceuticals, Abbott Laboratories, Eli Lilly, Melinta Therapeutics, Sanofi, Daiichi Sankyo, Lupin, Apogepha, Astellas Pharma, Dr. Dunner, Kowa, Jiangxi Jimin Kexin Jinshuibao Pharmaceutical, Tianjin Tongrentang Group, Jiangsu Hengrui Pharmaceutical, Hunan Qianjin Xiang River Pharmaceutical, Kunming Jida Pharmaceutical, Jiangsu Lianhuan Pharmaceutical
Forecast units USD million in value
Report coverage Revenue and volume forecast, company share, competitive landscape, growth factors and trends

Chapter Outline

  • Chapter 1: Introduces the report scope of the report, global total market size. This chapter also provides the market dynamics, latest developments of the market, the driving factors and restrictive factors of the market, the challenges and risks faced by manufacturers in the industry, and the analysis of relevant policies in the industry.
  • Chapter 2: Detailed analysis of Urinary System Drugs manufacturers competitive landscape, revenue market share, latest development plan, merger, and acquisition information, etc.
  • Chapter 3: Provides the analysis of various market segments by Type, covering the market size and development potential of each market segment, to help readers find the blue ocean market in different market segments.
  • Chapter 4: Provides the analysis of various market segments by Application, covering the market size and development potential of each market segment, to help readers find the blue ocean market in different downstream markets.
  • Chapter 5: Revenue of Urinary System Drugs in regional level. It provides a quantitative analysis of the market size and development potential of each region and introduces the market development, future development prospects, market space, and market size of each country in the world.
  • Chapter 6: Revenue of Urinary System Drugs in country level. It provides sigmate data by Type, and by Application for each country/region.
  • Chapter 7: Provides profiles of key players, introducing the basic situation of the main companies in the market in detail, including product revenue, gross margin, product introduction, recent development, etc.
  • Chapter 8: Analysis of industrial chain, including the upstream and downstream of the industry.
  • Chapter 9: Conclusion.

FAQ for this report

Who are the main players in the Urinary System Drugs - Market report?

Ans: The main players in the Urinary System Drugs - Market are Johnson & Johnson, Bayer, Pfizer, GSK, Boehringer Ingelheim, Roche, Novartis, AstraZeneca, Dr. Reddy’s Laboratories, Mylan, Sun Pharma, Cipla, Merck, Cubist Pharmaceuticals, Abbott Laboratories, Eli Lilly, Melinta Therapeutics, Sanofi, Daiichi Sankyo, Lupin, Apogepha, Astellas Pharma, Dr. Dunner, Kowa, Jiangxi Jimin Kexin Jinshuibao Pharmaceutical, Tianjin Tongrentang Group, Jiangsu Hengrui Pharmaceutical, Hunan Qianjin Xiang River Pharmaceutical, Kunming Jida Pharmaceutical, Jiangsu Lianhuan Pharmaceutical

What are the Application segmentation covered in the Urinary System Drugs - Market report?

Ans: The Applications covered in the Urinary System Drugs - Market report are Kidney Disease Medication, Medication For Prostate Disease, Male Dysfunction, Lithotripsy Drug, Others

What are the Type segmentation covered in the Urinary System Drugs - Market report?

Ans: The Types covered in the Urinary System Drugs - Market report are Injection, Tablets, Capsule, Suppository, Granules, Powder, Pills, Cream, Others

1 Market Overview
1.1 Urinary System Drugs Product Introduction
1.2 Global Urinary System Drugs Market Size Forecast
1.3 Urinary System Drugs Market Trends & Drivers
1.3.1 Urinary System Drugs Industry Trends
1.3.2 Urinary System Drugs Market Drivers & Opportunity
1.3.3 Urinary System Drugs Market Challenges
1.3.4 Urinary System Drugs Market Restraints
1.4 Assumptions and Limitations
1.5 Study Objectives
1.6 Years Considered
2 Competitive Analysis by Company
2.1 Global Urinary System Drugs Players Revenue Ranking (2023)
2.2 Global Urinary System Drugs Revenue by Company (2019-2024)
2.3 Key Companies Urinary System Drugs Manufacturing Base Distribution and Headquarters
2.4 Key Companies Urinary System Drugs Product Offered
2.5 Key Companies Time to Begin Mass Production of Urinary System Drugs
2.6 Urinary System Drugs Market Competitive Analysis
2.6.1 Urinary System Drugs Market Concentration Rate (2019-2024)
2.6.2 Global 5 and 10 Largest Companies by Urinary System Drugs Revenue in 2023
2.6.3 Global Top Companies by Company Type (Tier 1, Tier 2, and Tier 3) & (based on the Revenue in Urinary System Drugs as of 2023)
2.7 Mergers & Acquisitions, Expansion
3 Segmentation by Type
3.1 Introduction by Type
3.1.1 Injection
3.1.2 Tablets
3.1.3 Capsule
3.1.4 Suppository
3.1.5 Granules
3.1.6 Powder
3.1.7 Pills
3.1.8 Cream
3.1.9 Others
3.2 Global Urinary System Drugs Sales Value by Type
3.2.1 Global Urinary System Drugs Sales Value by Type (2019 VS 2023 VS 2030)
3.2.2 Global Urinary System Drugs Sales Value, by Type (2019-2030)
3.2.3 Global Urinary System Drugs Sales Value, by Type (%) (2019-2030)
4 Segmentation by Application
4.1 Introduction by Application
4.1.1 Kidney Disease Medication
4.1.2 Medication For Prostate Disease
4.1.3 Male Dysfunction
4.1.4 Lithotripsy Drug
4.1.5 Others
4.2 Global Urinary System Drugs Sales Value by Application
4.2.1 Global Urinary System Drugs Sales Value by Application (2019 VS 2023 VS 2030)
4.2.2 Global Urinary System Drugs Sales Value, by Application (2019-2030)
4.2.3 Global Urinary System Drugs Sales Value, by Application (%) (2019-2030)
5 Segmentation by Region
5.1 Global Urinary System Drugs Sales Value by Region
5.1.1 Global Urinary System Drugs Sales Value by Region: 2019 VS 2023 VS 2030
5.1.2 Global Urinary System Drugs Sales Value by Region (2019-2024)
5.1.3 Global Urinary System Drugs Sales Value by Region (2025-2030)
5.1.4 Global Urinary System Drugs Sales Value by Region (%), (2019-2030)
5.2 North America
5.2.1 North America Urinary System Drugs Sales Value, 2019-2030
5.2.2 North America Urinary System Drugs Sales Value by Country (%), 2023 VS 2030
5.3 Europe
5.3.1 Europe Urinary System Drugs Sales Value, 2019-2030
5.3.2 Europe Urinary System Drugs Sales Value by Country (%), 2023 VS 2030
5.4 Asia Pacific
5.4.1 Asia Pacific Urinary System Drugs Sales Value, 2019-2030
5.4.2 Asia Pacific Urinary System Drugs Sales Value by Country (%), 2023 VS 2030
5.5 South America
5.5.1 South America Urinary System Drugs Sales Value, 2019-2030
5.5.2 South America Urinary System Drugs Sales Value by Country (%), 2023 VS 2030
5.6 Middle East & Africa
5.6.1 Middle East & Africa Urinary System Drugs Sales Value, 2019-2030
5.6.2 Middle East & Africa Urinary System Drugs Sales Value by Country (%), 2023 VS 2030
6 Segmentation by Key Countries/Regions
6.1 Key Countries/Regions Urinary System Drugs Sales Value Growth Trends, 2019 VS 2023 VS 2030
6.2 Key Countries/Regions Urinary System Drugs Sales Value
6.3 United States
6.3.1 United States Urinary System Drugs Sales Value, 2019-2030
6.3.2 United States Urinary System Drugs Sales Value by Type (%), 2023 VS 2030
6.3.3 United States Urinary System Drugs Sales Value by Application, 2023 VS 2030
6.4 Europe
6.4.1 Europe Urinary System Drugs Sales Value, 2019-2030
6.4.2 Europe Urinary System Drugs Sales Value by Type (%), 2023 VS 2030
6.4.3 Europe Urinary System Drugs Sales Value by Application, 2023 VS 2030
6.5 China
6.5.1 China Urinary System Drugs Sales Value, 2019-2030
6.5.2 China Urinary System Drugs Sales Value by Type (%), 2023 VS 2030
6.5.3 China Urinary System Drugs Sales Value by Application, 2023 VS 2030
6.6 Japan
6.6.1 Japan Urinary System Drugs Sales Value, 2019-2030
6.6.2 Japan Urinary System Drugs Sales Value by Type (%), 2023 VS 2030
6.6.3 Japan Urinary System Drugs Sales Value by Application, 2023 VS 2030
6.7 South Korea
6.7.1 South Korea Urinary System Drugs Sales Value, 2019-2030
6.7.2 South Korea Urinary System Drugs Sales Value by Type (%), 2023 VS 2030
6.7.3 South Korea Urinary System Drugs Sales Value by Application, 2023 VS 2030
6.8 Southeast Asia
6.8.1 Southeast Asia Urinary System Drugs Sales Value, 2019-2030
6.8.2 Southeast Asia Urinary System Drugs Sales Value by Type (%), 2023 VS 2030
6.8.3 Southeast Asia Urinary System Drugs Sales Value by Application, 2023 VS 2030
6.9 India
6.9.1 India Urinary System Drugs Sales Value, 2019-2030
6.9.2 India Urinary System Drugs Sales Value by Type (%), 2023 VS 2030
6.9.3 India Urinary System Drugs Sales Value by Application, 2023 VS 2030
7 Company Profiles
7.1 Johnson & Johnson
7.1.1 Johnson & Johnson Profile
7.1.2 Johnson & Johnson Main Business
7.1.3 Johnson & Johnson Urinary System Drugs Products, Services and Solutions
7.1.4 Johnson & Johnson Urinary System Drugs Revenue (US$ Million) & (2019-2024)
7.1.5 Johnson & Johnson Recent Developments
7.2 Bayer
7.2.1 Bayer Profile
7.2.2 Bayer Main Business
7.2.3 Bayer Urinary System Drugs Products, Services and Solutions
7.2.4 Bayer Urinary System Drugs Revenue (US$ Million) & (2019-2024)
7.2.5 Bayer Recent Developments
7.3 Pfizer
7.3.1 Pfizer Profile
7.3.2 Pfizer Main Business
7.3.3 Pfizer Urinary System Drugs Products, Services and Solutions
7.3.4 Pfizer Urinary System Drugs Revenue (US$ Million) & (2019-2024)
7.3.5 GSK Recent Developments
7.4 GSK
7.4.1 GSK Profile
7.4.2 GSK Main Business
7.4.3 GSK Urinary System Drugs Products, Services and Solutions
7.4.4 GSK Urinary System Drugs Revenue (US$ Million) & (2019-2024)
7.4.5 GSK Recent Developments
7.5 Boehringer Ingelheim
7.5.1 Boehringer Ingelheim Profile
7.5.2 Boehringer Ingelheim Main Business
7.5.3 Boehringer Ingelheim Urinary System Drugs Products, Services and Solutions
7.5.4 Boehringer Ingelheim Urinary System Drugs Revenue (US$ Million) & (2019-2024)
7.5.5 Boehringer Ingelheim Recent Developments
7.6 Roche
7.6.1 Roche Profile
7.6.2 Roche Main Business
7.6.3 Roche Urinary System Drugs Products, Services and Solutions
7.6.4 Roche Urinary System Drugs Revenue (US$ Million) & (2019-2024)
7.6.5 Roche Recent Developments
7.7 Novartis
7.7.1 Novartis Profile
7.7.2 Novartis Main Business
7.7.3 Novartis Urinary System Drugs Products, Services and Solutions
7.7.4 Novartis Urinary System Drugs Revenue (US$ Million) & (2019-2024)
7.7.5 Novartis Recent Developments
7.8 AstraZeneca
7.8.1 AstraZeneca Profile
7.8.2 AstraZeneca Main Business
7.8.3 AstraZeneca Urinary System Drugs Products, Services and Solutions
7.8.4 AstraZeneca Urinary System Drugs Revenue (US$ Million) & (2019-2024)
7.8.5 AstraZeneca Recent Developments
7.9 Dr. Reddy’s Laboratories
7.9.1 Dr. Reddy’s Laboratories Profile
7.9.2 Dr. Reddy’s Laboratories Main Business
7.9.3 Dr. Reddy’s Laboratories Urinary System Drugs Products, Services and Solutions
7.9.4 Dr. Reddy’s Laboratories Urinary System Drugs Revenue (US$ Million) & (2019-2024)
7.9.5 Dr. Reddy’s Laboratories Recent Developments
7.10 Mylan
7.10.1 Mylan Profile
7.10.2 Mylan Main Business
7.10.3 Mylan Urinary System Drugs Products, Services and Solutions
7.10.4 Mylan Urinary System Drugs Revenue (US$ Million) & (2019-2024)
7.10.5 Mylan Recent Developments
7.11 Sun Pharma
7.11.1 Sun Pharma Profile
7.11.2 Sun Pharma Main Business
7.11.3 Sun Pharma Urinary System Drugs Products, Services and Solutions
7.11.4 Sun Pharma Urinary System Drugs Revenue (US$ Million) & (2019-2024)
7.11.5 Sun Pharma Recent Developments
7.12 Cipla
7.12.1 Cipla Profile
7.12.2 Cipla Main Business
7.12.3 Cipla Urinary System Drugs Products, Services and Solutions
7.12.4 Cipla Urinary System Drugs Revenue (US$ Million) & (2019-2024)
7.12.5 Cipla Recent Developments
7.13 Merck
7.13.1 Merck Profile
7.13.2 Merck Main Business
7.13.3 Merck Urinary System Drugs Products, Services and Solutions
7.13.4 Merck Urinary System Drugs Revenue (US$ Million) & (2019-2024)
7.13.5 Merck Recent Developments
7.14 Cubist Pharmaceuticals
7.14.1 Cubist Pharmaceuticals Profile
7.14.2 Cubist Pharmaceuticals Main Business
7.14.3 Cubist Pharmaceuticals Urinary System Drugs Products, Services and Solutions
7.14.4 Cubist Pharmaceuticals Urinary System Drugs Revenue (US$ Million) & (2019-2024)
7.14.5 Cubist Pharmaceuticals Recent Developments
7.15 Abbott Laboratories
7.15.1 Abbott Laboratories Profile
7.15.2 Abbott Laboratories Main Business
7.15.3 Abbott Laboratories Urinary System Drugs Products, Services and Solutions
7.15.4 Abbott Laboratories Urinary System Drugs Revenue (US$ Million) & (2019-2024)
7.15.5 Abbott Laboratories Recent Developments
7.16 Eli Lilly
7.16.1 Eli Lilly Profile
7.16.2 Eli Lilly Main Business
7.16.3 Eli Lilly Urinary System Drugs Products, Services and Solutions
7.16.4 Eli Lilly Urinary System Drugs Revenue (US$ Million) & (2019-2024)
7.16.5 Eli Lilly Recent Developments
7.17 Melinta Therapeutics
7.17.1 Melinta Therapeutics Profile
7.17.2 Melinta Therapeutics Main Business
7.17.3 Melinta Therapeutics Urinary System Drugs Products, Services and Solutions
7.17.4 Melinta Therapeutics Urinary System Drugs Revenue (US$ Million) & (2019-2024)
7.17.5 Melinta Therapeutics Recent Developments
7.18 Sanofi
7.18.1 Sanofi Profile
7.18.2 Sanofi Main Business
7.18.3 Sanofi Urinary System Drugs Products, Services and Solutions
7.18.4 Sanofi Urinary System Drugs Revenue (US$ Million) & (2019-2024)
7.18.5 Sanofi Recent Developments
7.19 Daiichi Sankyo
7.19.1 Daiichi Sankyo Profile
7.19.2 Daiichi Sankyo Main Business
7.19.3 Daiichi Sankyo Urinary System Drugs Products, Services and Solutions
7.19.4 Daiichi Sankyo Urinary System Drugs Revenue (US$ Million) & (2019-2024)
7.19.5 Daiichi Sankyo Recent Developments
7.20 Lupin
7.20.1 Lupin Profile
7.20.2 Lupin Main Business
7.20.3 Lupin Urinary System Drugs Products, Services and Solutions
7.20.4 Lupin Urinary System Drugs Revenue (US$ Million) & (2019-2024)
7.20.5 Lupin Recent Developments
7.21 Apogepha
7.21.1 Apogepha Profile
7.21.2 Apogepha Main Business
7.21.3 Apogepha Urinary System Drugs Products, Services and Solutions
7.21.4 Apogepha Urinary System Drugs Revenue (US$ Million) & (2019-2024)
7.21.5 Apogepha Recent Developments
7.22 Astellas Pharma
7.22.1 Astellas Pharma Profile
7.22.2 Astellas Pharma Main Business
7.22.3 Astellas Pharma Urinary System Drugs Products, Services and Solutions
7.22.4 Astellas Pharma Urinary System Drugs Revenue (US$ Million) & (2019-2024)
7.22.5 Astellas Pharma Recent Developments
7.23 Dr. Dunner
7.23.1 Dr. Dunner Profile
7.23.2 Dr. Dunner Main Business
7.23.3 Dr. Dunner Urinary System Drugs Products, Services and Solutions
7.23.4 Dr. Dunner Urinary System Drugs Revenue (US$ Million) & (2019-2024)
7.23.5 Dr. Dunner Recent Developments
7.24 Kowa
7.24.1 Kowa Profile
7.24.2 Kowa Main Business
7.24.3 Kowa Urinary System Drugs Products, Services and Solutions
7.24.4 Kowa Urinary System Drugs Revenue (US$ Million) & (2019-2024)
7.24.5 Kowa Recent Developments
7.25 Jiangxi Jimin Kexin Jinshuibao Pharmaceutical
7.25.1 Jiangxi Jimin Kexin Jinshuibao Pharmaceutical Profile
7.25.2 Jiangxi Jimin Kexin Jinshuibao Pharmaceutical Main Business
7.25.3 Jiangxi Jimin Kexin Jinshuibao Pharmaceutical Urinary System Drugs Products, Services and Solutions
7.25.4 Jiangxi Jimin Kexin Jinshuibao Pharmaceutical Urinary System Drugs Revenue (US$ Million) & (2019-2024)
7.25.5 Jiangxi Jimin Kexin Jinshuibao Pharmaceutical Recent Developments
7.26 Tianjin Tongrentang Group
7.26.1 Tianjin Tongrentang Group Profile
7.26.2 Tianjin Tongrentang Group Main Business
7.26.3 Tianjin Tongrentang Group Urinary System Drugs Products, Services and Solutions
7.26.4 Tianjin Tongrentang Group Urinary System Drugs Revenue (US$ Million) & (2019-2024)
7.26.5 Tianjin Tongrentang Group Recent Developments
7.27 Jiangsu Hengrui Pharmaceutical
7.27.1 Jiangsu Hengrui Pharmaceutical Profile
7.27.2 Jiangsu Hengrui Pharmaceutical Main Business
7.27.3 Jiangsu Hengrui Pharmaceutical Urinary System Drugs Products, Services and Solutions
7.27.4 Jiangsu Hengrui Pharmaceutical Urinary System Drugs Revenue (US$ Million) & (2019-2024)
7.27.5 Jiangsu Hengrui Pharmaceutical Recent Developments
7.28 Hunan Qianjin Xiang River Pharmaceutical
7.28.1 Hunan Qianjin Xiang River Pharmaceutical Profile
7.28.2 Hunan Qianjin Xiang River Pharmaceutical Main Business
7.28.3 Hunan Qianjin Xiang River Pharmaceutical Urinary System Drugs Products, Services and Solutions
7.28.4 Hunan Qianjin Xiang River Pharmaceutical Urinary System Drugs Revenue (US$ Million) & (2019-2024)
7.28.5 Hunan Qianjin Xiang River Pharmaceutical Recent Developments
7.29 Kunming Jida Pharmaceutical
7.29.1 Kunming Jida Pharmaceutical Profile
7.29.2 Kunming Jida Pharmaceutical Main Business
7.29.3 Kunming Jida Pharmaceutical Urinary System Drugs Products, Services and Solutions
7.29.4 Kunming Jida Pharmaceutical Urinary System Drugs Revenue (US$ Million) & (2019-2024)
7.29.5 Kunming Jida Pharmaceutical Recent Developments
7.30 Jiangsu Lianhuan Pharmaceutical
7.30.1 Jiangsu Lianhuan Pharmaceutical Profile
7.30.2 Jiangsu Lianhuan Pharmaceutical Main Business
7.30.3 Jiangsu Lianhuan Pharmaceutical Urinary System Drugs Products, Services and Solutions
7.30.4 Jiangsu Lianhuan Pharmaceutical Urinary System Drugs Revenue (US$ Million) & (2019-2024)
7.30.5 Jiangsu Lianhuan Pharmaceutical Recent Developments
8 Industry Chain Analysis
8.1 Urinary System Drugs Industrial Chain
8.2 Urinary System Drugs Upstream Analysis
8.2.1 Key Raw Materials
8.2.2 Raw Materials Key Suppliers
8.2.3 Manufacturing Cost Structure
8.3 Midstream Analysis
8.4 Downstream Analysis (Customers Analysis)
8.5 Sales Model and Sales Channels
8.5.1 Urinary System Drugs Sales Model
8.5.2 Sales Channel
8.5.3 Urinary System Drugs Distributors
9 Research Findings and Conclusion
10 Appendix
10.1 Research Methodology
10.1.1 Methodology/Research Approach
10.1.2 Data Source
10.2 Author Details
10.3 Disclaimer
List of Tables
    Table 1. Urinary System Drugs Market Trends
    Table 2. Urinary System Drugs Market Drivers & Opportunity
    Table 3. Urinary System Drugs Market Challenges
    Table 4. Urinary System Drugs Market Restraints
    Table 5. Global Urinary System Drugs Revenue by Company (2019-2024) & (US$ Million)
    Table 6. Global Urinary System Drugs Revenue Market Share by Company (2019-2024)
    Table 7. Key Companies Urinary System Drugs Manufacturing Base Distribution and Headquarters
    Table 8. Key Companies Urinary System Drugs Product Type
    Table 9. Key Companies Time to Begin Mass Production of Urinary System Drugs
    Table 10. Global Urinary System Drugs Companies Market Concentration Ratio (CR5 and HHI)
    Table 11. Global Top Companies Market Share by Company Type (Tier 1, Tier 2, and Tier 3) & (based on the Revenue in Urinary System Drugs as of 2023)
    Table 12. Mergers & Acquisitions, Expansion Plans
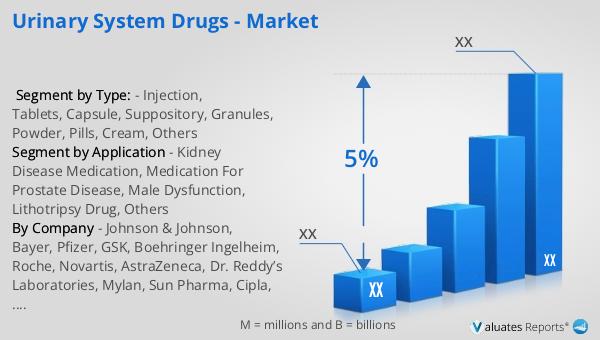
    Table 13. Global Urinary System Drugs Sales Value by Type: 2019 VS 2023 VS 2030 (US$ Million)
    Table 14. Global Urinary System Drugs Sales Value by Type (2019-2024) & (US$ Million)
    Table 15. Global Urinary System Drugs Sales Value by Type (2025-2030) & (US$ Million)
    Table 16. Global Urinary System Drugs Sales Market Share in Value by Type (2019-2024) & (%)
    Table 17. Global Urinary System Drugs Sales Market Share in Value by Type (2025-2030) & (%)
    Table 18. Global Urinary System Drugs Sales Value by Application: 2019 VS 2023 VS 2030 (US$ Million)
    Table 19. Global Urinary System Drugs Sales Value by Application (2019-2024) & (US$ Million)
    Table 20. Global Urinary System Drugs Sales Value by Application (2025-2030) & (US$ Million)
    Table 21. Global Urinary System Drugs Sales Market Share in Value by Application (2019-2024) & (%)
    Table 22. Global Urinary System Drugs Sales Market Share in Value by Application (2025-2030) & (%)
    Table 23. Global Urinary System Drugs Sales Value by Region: 2019 VS 2023 VS 2030 (US$ Million)
    Table 24. Global Urinary System Drugs Sales Value by Region (2019-2024) & (US$ Million)
    Table 25. Global Urinary System Drugs Sales Value by Region (2025-2030) & (US$ Million)
    Table 26. Global Urinary System Drugs Sales Value by Region (2019-2024) & (%)
    Table 27. Global Urinary System Drugs Sales Value by Region (2025-2030) & (%)
    Table 28. Key Countries/Regions Urinary System Drugs Sales Value Growth Trends, (US$ Million): 2019 VS 2023 VS 2030
    Table 29. Key Countries/Regions Urinary System Drugs Sales Value, (2019-2024) & (US$ Million)
    Table 30. Key Countries/Regions Urinary System Drugs Sales Value, (2025-2030) & (US$ Million)
    Table 31. Johnson & Johnson Basic Information List
    Table 32. Johnson & Johnson Description and Business Overview
    Table 33. Johnson & Johnson Urinary System Drugs Products, Services and Solutions
    Table 34. Revenue (US$ Million) in Urinary System Drugs Business of Johnson & Johnson (2019-2024)
    Table 35. Johnson & Johnson Recent Developments
    Table 36. Bayer Basic Information List
    Table 37. Bayer Description and Business Overview
    Table 38. Bayer Urinary System Drugs Products, Services and Solutions
    Table 39. Revenue (US$ Million) in Urinary System Drugs Business of Bayer (2019-2024)
    Table 40. Bayer Recent Developments
    Table 41. Pfizer Basic Information List
    Table 42. Pfizer Description and Business Overview
    Table 43. Pfizer Urinary System Drugs Products, Services and Solutions
    Table 44. Revenue (US$ Million) in Urinary System Drugs Business of Pfizer (2019-2024)
    Table 45. Pfizer Recent Developments
    Table 46. GSK Basic Information List
    Table 47. GSK Description and Business Overview
    Table 48. GSK Urinary System Drugs Products, Services and Solutions
    Table 49. Revenue (US$ Million) in Urinary System Drugs Business of GSK (2019-2024)
    Table 50. GSK Recent Developments
    Table 51. Boehringer Ingelheim Basic Information List
    Table 52. Boehringer Ingelheim Description and Business Overview
    Table 53. Boehringer Ingelheim Urinary System Drugs Products, Services and Solutions
    Table 54. Revenue (US$ Million) in Urinary System Drugs Business of Boehringer Ingelheim (2019-2024)
    Table 55. Boehringer Ingelheim Recent Developments
    Table 56. Roche Basic Information List
    Table 57. Roche Description and Business Overview
    Table 58. Roche Urinary System Drugs Products, Services and Solutions
    Table 59. Revenue (US$ Million) in Urinary System Drugs Business of Roche (2019-2024)
    Table 60. Roche Recent Developments
    Table 61. Novartis Basic Information List
    Table 62. Novartis Description and Business Overview
    Table 63. Novartis Urinary System Drugs Products, Services and Solutions
    Table 64. Revenue (US$ Million) in Urinary System Drugs Business of Novartis (2019-2024)
    Table 65. Novartis Recent Developments
    Table 66. AstraZeneca Basic Information List
    Table 67. AstraZeneca Description and Business Overview
    Table 68. AstraZeneca Urinary System Drugs Products, Services and Solutions
    Table 69. Revenue (US$ Million) in Urinary System Drugs Business of AstraZeneca (2019-2024)
    Table 70. AstraZeneca Recent Developments
    Table 71. Dr. Reddy’s Laboratories Basic Information List
    Table 72. Dr. Reddy’s Laboratories Description and Business Overview
    Table 73. Dr. Reddy’s Laboratories Urinary System Drugs Products, Services and Solutions
    Table 74. Revenue (US$ Million) in Urinary System Drugs Business of Dr. Reddy’s Laboratories (2019-2024)
    Table 75. Dr. Reddy’s Laboratories Recent Developments
    Table 76. Mylan Basic Information List
    Table 77. Mylan Description and Business Overview
    Table 78. Mylan Urinary System Drugs Products, Services and Solutions
    Table 79. Revenue (US$ Million) in Urinary System Drugs Business of Mylan (2019-2024)
    Table 80. Mylan Recent Developments
    Table 81. Sun Pharma Basic Information List
    Table 82. Sun Pharma Description and Business Overview
    Table 83. Sun Pharma Urinary System Drugs Products, Services and Solutions
    Table 84. Revenue (US$ Million) in Urinary System Drugs Business of Sun Pharma (2019-2024)
    Table 85. Sun Pharma Recent Developments
    Table 86. Cipla Basic Information List
    Table 87. Cipla Description and Business Overview
    Table 88. Cipla Urinary System Drugs Products, Services and Solutions
    Table 89. Revenue (US$ Million) in Urinary System Drugs Business of Cipla (2019-2024)
    Table 90. Cipla Recent Developments
    Table 91. Merck Basic Information List
    Table 92. Merck Description and Business Overview
    Table 93. Merck Urinary System Drugs Products, Services and Solutions
    Table 94. Revenue (US$ Million) in Urinary System Drugs Business of Merck (2019-2024)
    Table 95. Merck Recent Developments
    Table 96. Cubist Pharmaceuticals Basic Information List
    Table 97. Cubist Pharmaceuticals Description and Business Overview
    Table 98. Cubist Pharmaceuticals Urinary System Drugs Products, Services and Solutions
    Table 99. Revenue (US$ Million) in Urinary System Drugs Business of Cubist Pharmaceuticals (2019-2024)
    Table 100. Cubist Pharmaceuticals Recent Developments
    Table 101. Abbott Laboratories Basic Information List
    Table 102. Abbott Laboratories Description and Business Overview
    Table 103. Abbott Laboratories Urinary System Drugs Products, Services and Solutions
    Table 104. Revenue (US$ Million) in Urinary System Drugs Business of Abbott Laboratories (2019-2024)
    Table 105. Abbott Laboratories Recent Developments
    Table 106. Eli Lilly Basic Information List
    Table 107. Eli Lilly Description and Business Overview
    Table 108. Eli Lilly Urinary System Drugs Products, Services and Solutions
    Table 109. Revenue (US$ Million) in Urinary System Drugs Business of Eli Lilly (2019-2024)
    Table 110. Eli Lilly Recent Developments
    Table 111. Melinta Therapeutics Basic Information List
    Table 112. Melinta Therapeutics Description and Business Overview
    Table 113. Melinta Therapeutics Urinary System Drugs Products, Services and Solutions
    Table 114. Revenue (US$ Million) in Urinary System Drugs Business of Melinta Therapeutics (2019-2024)
    Table 115. Melinta Therapeutics Recent Developments
    Table 116. Sanofi Basic Information List
    Table 117. Sanofi Description and Business Overview
    Table 118. Sanofi Urinary System Drugs Products, Services and Solutions
    Table 119. Revenue (US$ Million) in Urinary System Drugs Business of Sanofi (2019-2024)
    Table 120. Sanofi Recent Developments
    Table 121. Daiichi Sankyo Basic Information List
    Table 122. Daiichi Sankyo Description and Business Overview
    Table 123. Daiichi Sankyo Urinary System Drugs Products, Services and Solutions
    Table 124. Revenue (US$ Million) in Urinary System Drugs Business of Daiichi Sankyo (2019-2024)
    Table 125. Daiichi Sankyo Recent Developments
    Table 126. Lupin Basic Information List
    Table 127. Lupin Description and Business Overview
    Table 128. Lupin Urinary System Drugs Products, Services and Solutions
    Table 129. Revenue (US$ Million) in Urinary System Drugs Business of Lupin (2019-2024)
    Table 130. Lupin Recent Developments
    Table 131. Apogepha Basic Information List
    Table 132. Apogepha Description and Business Overview
    Table 133. Apogepha Urinary System Drugs Products, Services and Solutions
    Table 134. Revenue (US$ Million) in Urinary System Drugs Business of Apogepha (2019-2024)
    Table 135. Apogepha Recent Developments
    Table 136. Astellas Pharma Basic Information List
    Table 137. Astellas Pharma Description and Business Overview
    Table 138. Astellas Pharma Urinary System Drugs Products, Services and Solutions
    Table 139. Revenue (US$ Million) in Urinary System Drugs Business of Astellas Pharma (2019-2024)
    Table 140. Astellas Pharma Recent Developments
    Table 141. Dr. Dunner Basic Information List
    Table 142. Dr. Dunner Description and Business Overview
    Table 143. Dr. Dunner Urinary System Drugs Products, Services and Solutions
    Table 144. Revenue (US$ Million) in Urinary System Drugs Business of Dr. Dunner (2019-2024)
    Table 145. Dr. Dunner Recent Developments
    Table 146. Kowa Basic Information List
    Table 147. Kowa Description and Business Overview
    Table 148. Kowa Urinary System Drugs Products, Services and Solutions
    Table 149. Revenue (US$ Million) in Urinary System Drugs Business of Kowa (2019-2024)
    Table 150. Kowa Recent Developments
    Table 151. Jiangxi Jimin Kexin Jinshuibao Pharmaceutical Basic Information List
    Table 152. Jiangxi Jimin Kexin Jinshuibao Pharmaceutical Description and Business Overview
    Table 153. Jiangxi Jimin Kexin Jinshuibao Pharmaceutical Urinary System Drugs Products, Services and Solutions
    Table 154. Revenue (US$ Million) in Urinary System Drugs Business of Jiangxi Jimin Kexin Jinshuibao Pharmaceutical (2019-2024)
    Table 155. Jiangxi Jimin Kexin Jinshuibao Pharmaceutical Recent Developments
    Table 156. Tianjin Tongrentang Group Basic Information List
    Table 157. Tianjin Tongrentang Group Description and Business Overview
    Table 158. Tianjin Tongrentang Group Urinary System Drugs Products, Services and Solutions
    Table 159. Revenue (US$ Million) in Urinary System Drugs Business of Tianjin Tongrentang Group (2019-2024)
    Table 160. Tianjin Tongrentang Group Recent Developments
    Table 161. Jiangsu Hengrui Pharmaceutical Basic Information List
    Table 162. Jiangsu Hengrui Pharmaceutical Description and Business Overview
    Table 163. Jiangsu Hengrui Pharmaceutical Urinary System Drugs Products, Services and Solutions
    Table 164. Revenue (US$ Million) in Urinary System Drugs Business of Jiangsu Hengrui Pharmaceutical (2019-2024)
    Table 165. Jiangsu Hengrui Pharmaceutical Recent Developments
    Table 166. Hunan Qianjin Xiang River Pharmaceutical Basic Information List
    Table 167. Hunan Qianjin Xiang River Pharmaceutical Description and Business Overview
    Table 168. Hunan Qianjin Xiang River Pharmaceutical Urinary System Drugs Products, Services and Solutions
    Table 169. Revenue (US$ Million) in Urinary System Drugs Business of Hunan Qianjin Xiang River Pharmaceutical (2019-2024)
    Table 170. Hunan Qianjin Xiang River Pharmaceutical Recent Developments
    Table 171. Kunming Jida Pharmaceutical Basic Information List
    Table 172. Kunming Jida Pharmaceutical Description and Business Overview
    Table 173. Kunming Jida Pharmaceutical Urinary System Drugs Products, Services and Solutions
    Table 174. Revenue (US$ Million) in Urinary System Drugs Business of Kunming Jida Pharmaceutical (2019-2024)
    Table 175. Kunming Jida Pharmaceutical Recent Developments
    Table 176. Jiangsu Lianhuan Pharmaceutical Basic Information List
    Table 177. Jiangsu Lianhuan Pharmaceutical Description and Business Overview
    Table 178. Jiangsu Lianhuan Pharmaceutical Urinary System Drugs Products, Services and Solutions
    Table 179. Revenue (US$ Million) in Urinary System Drugs Business of Jiangsu Lianhuan Pharmaceutical (2019-2024)
    Table 180. Jiangsu Lianhuan Pharmaceutical Recent Developments
    Table 181. Key Raw Materials Lists
    Table 182. Raw Materials Key Suppliers Lists
    Table 183. Urinary System Drugs Downstream Customers
    Table 184. Urinary System Drugs Distributors List
    Table 185. Research Programs/Design for This Report
    Table 186. Key Data Information from Secondary Sources
    Table 187. Key Data Information from Primary Sources
    Table 188. Business Unit and Senior & Team Lead Analysts
List of Figures
    Figure 1. Urinary System Drugs Product Picture
    Figure 2. Global Urinary System Drugs Sales Value, 2019 VS 2023 VS 2030 (US$ Million)
    Figure 3. Global Urinary System Drugs Sales Value (2019-2030) & (US$ Million)
    Figure 4. Urinary System Drugs Report Years Considered
    Figure 5. Global Urinary System Drugs Players Revenue Ranking (2023) & (US$ Million)
    Figure 6. The 5 and 10 Largest Manufacturers in the World: Market Share by Urinary System Drugs Revenue in 2023
    Figure 7. Urinary System Drugs Market Share by Company Type (Tier 1, Tier 2, and Tier 3): 2019 VS 2023
    Figure 8. Injection Picture
    Figure 9. Tablets Picture
    Figure 10. Capsule Picture
    Figure 11. Suppository Picture
    Figure 12. Granules Picture
    Figure 13. Powder Picture
    Figure 14. Pills Picture
    Figure 15. Cream Picture
    Figure 16. Others Picture
    Figure 17. Global Urinary System Drugs Sales Value by Type (2019 VS 2023 VS 2030) & (US$ Million)
    Figure 18. Global Urinary System Drugs Sales Value Market Share by Type, 2023 & 2030
    Figure 19. Product Picture of Kidney Disease Medication
    Figure 20. Product Picture of Medication For Prostate Disease
    Figure 21. Product Picture of Male Dysfunction
    Figure 22. Product Picture of Lithotripsy Drug
    Figure 23. Product Picture of Others
    Figure 24. Global Urinary System Drugs Sales Value by Application (2019 VS 2023 VS 2030) & (US$ Million)
    Figure 25. Global Urinary System Drugs Sales Value Market Share by Application, 2023 & 2030
    Figure 26. North America Urinary System Drugs Sales Value (2019-2030) & (US$ Million)
    Figure 27. North America Urinary System Drugs Sales Value by Country (%), 2023 VS 2030
    Figure 28. Europe Urinary System Drugs Sales Value (2019-2030) & (US$ Million)
    Figure 29. Europe Urinary System Drugs Sales Value by Country (%), 2023 VS 2030
    Figure 30. Asia Pacific Urinary System Drugs Sales Value (2019-2030) & (US$ Million)
    Figure 31. Asia Pacific Urinary System Drugs Sales Value by Country (%), 2023 VS 2030
    Figure 32. South America Urinary System Drugs Sales Value (2019-2030) & (US$ Million)
    Figure 33. South America Urinary System Drugs Sales Value by Country (%), 2023 VS 2030
    Figure 34. Middle East & Africa Urinary System Drugs Sales Value (2019-2030) & (US$ Million)
    Figure 35. Middle East & Africa Urinary System Drugs Sales Value by Country (%), 2023 VS 2030
    Figure 36. Key Countries/Regions Urinary System Drugs Sales Value (%), (2019-2030)
    Figure 37. United States Urinary System Drugs Sales Value, (2019-2030) & (US$ Million)
    Figure 38. United States Urinary System Drugs Sales Value by Type (%), 2023 VS 2030
    Figure 39. United States Urinary System Drugs Sales Value by Application (%), 2023 VS 2030
    Figure 40. Europe Urinary System Drugs Sales Value, (2019-2030) & (US$ Million)
    Figure 41. Europe Urinary System Drugs Sales Value by Type (%), 2023 VS 2030
    Figure 42. Europe Urinary System Drugs Sales Value by Application (%), 2023 VS 2030
    Figure 43. China Urinary System Drugs Sales Value, (2019-2030) & (US$ Million)
    Figure 44. China Urinary System Drugs Sales Value by Type (%), 2023 VS 2030
    Figure 45. China Urinary System Drugs Sales Value by Application (%), 2023 VS 2030
    Figure 46. Japan Urinary System Drugs Sales Value, (2019-2030) & (US$ Million)
    Figure 47. Japan Urinary System Drugs Sales Value by Type (%), 2023 VS 2030
    Figure 48. Japan Urinary System Drugs Sales Value by Application (%), 2023 VS 2030
    Figure 49. South Korea Urinary System Drugs Sales Value, (2019-2030) & (US$ Million)
    Figure 50. South Korea Urinary System Drugs Sales Value by Type (%), 2023 VS 2030
    Figure 51. South Korea Urinary System Drugs Sales Value by Application (%), 2023 VS 2030
    Figure 52. Southeast Asia Urinary System Drugs Sales Value, (2019-2030) & (US$ Million)
    Figure 53. Southeast Asia Urinary System Drugs Sales Value by Type (%), 2023 VS 2030
    Figure 54. Southeast Asia Urinary System Drugs Sales Value by Application (%), 2023 VS 2030
    Figure 55. India Urinary System Drugs Sales Value, (2019-2030) & (US$ Million)
    Figure 56. India Urinary System Drugs Sales Value by Type (%), 2023 VS 2030
    Figure 57. India Urinary System Drugs Sales Value by Application (%), 2023 VS 2030
    Figure 58. Urinary System Drugs Industrial Chain
    Figure 59. Urinary System Drugs Manufacturing Cost Structure
    Figure 60. Channels of Distribution (Direct Sales, and Distribution)
    Figure 61. Bottom-up and Top-down Approaches for This Report
    Figure 62. Data Triangulation
SELECT A FORMAT
Added to Cart
Electronic (PDF)

$3950

This license allows only one user to access the PDF.
Electronic (PDF)

$5925

This license allows 1 - 5 user to access the PDF, license is suitable for small groups of 5 users working together
Electronic (PDF)

$7900

This license allows users/teams in a same Enterprise to use this report, various departments within an enterpise can use this report
Add to Cart
Buy Now (15% Discount)

OUR CUSTOMER

Nano Dimension

SIMILAR REPORTS

OSZAR »